EXCEL REPORTING · KPIS · ALERTS
Teams keep using Excel.
Leaders see the big picture.
Follow one employee through the office and see how monthly Excel reports become a management view.
Simulated experience · October 2026 sample data
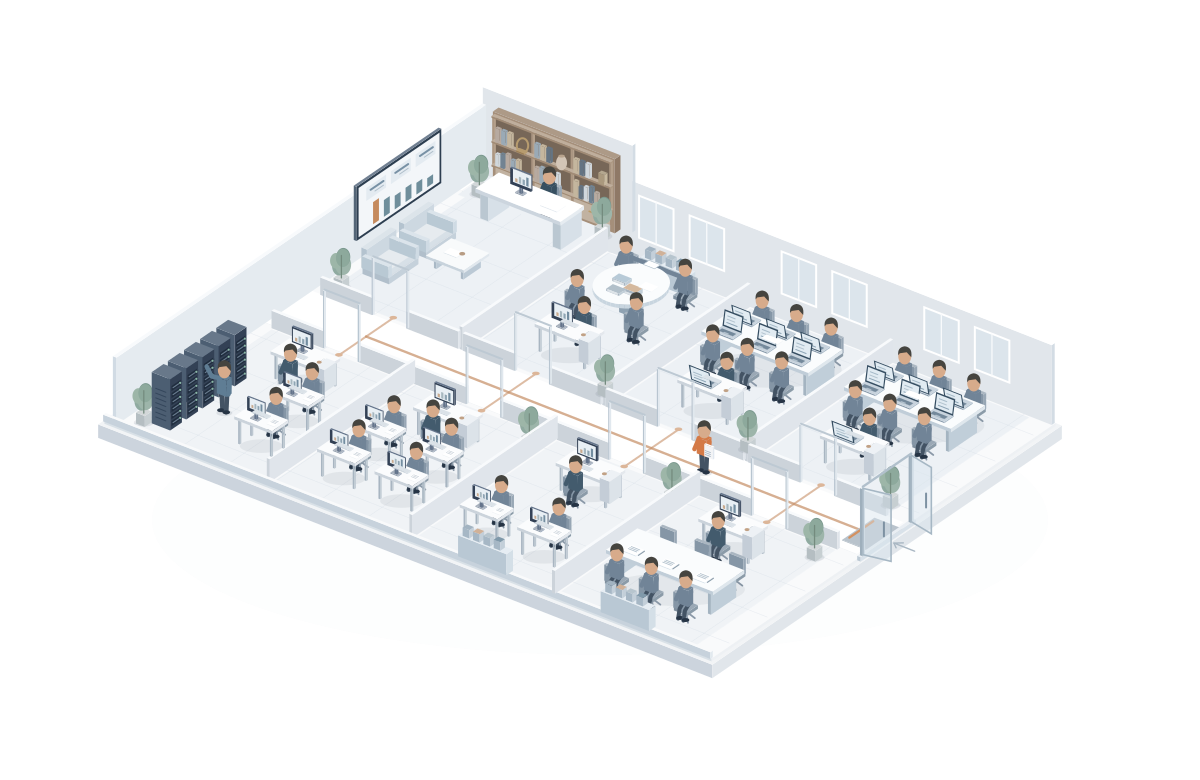
FROM REPORTS TO ACTION
One data workflow. Clear responsibility at every step.
- 01Choose templates
- 02Assign owners
- 03Submit Excel
- 04Validate
- 05Publish
- 06KPI dashboard
- 07Alerts
- 08Actions
A simulated experience with illustrative data. The departments and times are examples; each organization can adapt the structure to its way of working.
BUSINESS COMMAND CENTER
One published source.
More ways to understand it.
Teams provide reports within their assigned responsibilities. After review and publication, the figures support management views appropriate to each person’s permissions. Explore six views in the simulation below.
MANAGEMENT REPORTING TEMPLATES
Start with a template.
Make it fit your organization.
You do not have to design every metric from scratch. Five illustrative templates provide a starting point to adapt to your goals, size, and ways of working.
VALUE STARTS WITH EACH REPORTING CYCLE
Less time compiling.
More time deciding.
BIHUB is intended for businesses reporting in Excel, especially small and medium businesses combining figures from several teams. Value needs to be measured through real reporting cycles.
A separate file for each person.
- Scattered reports and repeated requests to teams.
- Manual compilation and reconciliation.
- Unclear final figures and hard-to-find sources.
A reporting process with clear ownership.
- Track each report’s status and owner.
- Use published figures in management views.
- Trace sources and history within your authorized scope.
From one person to many teams.
Start simply. Expand as needed.
- One person · Many rolesFocus on a few useful metrics for revenue, costs, and results.
- One company · Many teamsThe initial focus: consistent reports and a shared view of results.
- Many units · Several management levelsA development direction based on authorized scopes, subject to discovery and capability verification.
ONE ACCOUNT · MULTIPLE ORGANIZATIONS
Every workspace.
Its own clear boundaries.
One person can run a business, work at another organization, and join a project with a different role. This example shows one identity with data and permissions kept separate for each organization.
- Each company has its own identity, address, and data.
- A role in one company does not transfer to another.
- A unit can be a department, division, or project team.
- One person may hold several explicitly assigned roles.
My workspaces
One account, two roles in two organizations.
ABCABC Joint Stock Companyabc.bihub.vn · Example addressOwner
Own and administer the ABC Joint Stock Company workspace. BCC access, submissions, publication, and downloads follow the specific permissions granted.
XYZProject XYZxyz.bihub.vn · Example addressReporter
Receive templates, complete them, and submit reports within the assigned scope. Being an owner at ABC Joint Stock Company grants no administrative rights at Project XYZ.
One identity does not mean shared access. Organizations’ data is not automatically shared or consolidated.
TRACEABLE DATA · CLEAR ACCOUNTABILITY
Understand the figure.
Find the evidence.
BIHUB connects information with responsibility. Authorized people review the figures, decide what to publish, and choose the appropriate action.
Valid is not yet published
Passing validation is the first step. Published data becomes the dashboard’s official source; revisions retain their version, reason, and history.
Aggregate with meaning
Combine only compatible metrics. Do not count revenue twice or add monthly headcount snapshots. Missing targets or thresholds mean the result is not assessed.
Not assessed ≠ On targetTurn alerts into owned actions
Every alert has a source, period, and team. Follow-up work has an owner, deadline, and outcome; reading an alert does not resolve it.
Action needed · Owner assignedSCOPE & DEVELOPMENT VISION
Start with clarity.
Expand with evidence.
Understand how to start, what the simulation covers, and the directions ahead.
What is BIHUB, and how does it work with existing software?
BIHUB — Business Intelligence Hub — focuses on turning Excel reports into traceable management information with clear ownership. Businesses can keep using agreed Excel templates and draw on data from existing software.
Excel to Dashboard is the starting point; a Business Command Center is the vision. The implementation scope needs to match actual needs.
Can it accept any Excel file automatically?
Templates or column mappings, metric codes, units, and reporting periods need to be agreed first. Files differ across businesses; an arbitrary spreadsheet cannot be assumed to produce a meaningful dashboard automatically.
Start with one team, one period, and one template. Reconcile results with the report owner before expanding.
Who submits, publishes, and views reports?
Assigned reporters complete and submit reports. Authorized people review and publish them. Leaders and other authorized people access views within their assigned scope.
This simulation separates valid reports from published reports. Notifications, alerts, and follow-up actions run only in the browser.
Does a missing report count as zero?
Missing data must be identified; a blank is different from zero. Without a cost source, profit cannot be established; without a target, attainment cannot be assessed.
Only compatible metrics can be combined. Revenue tracked by both Sales and Accounting needs reconciliation and an official source to prevent double counting.
Can one person use several workspaces?
The illustrated organization model uses one identity across companies or projects with separate roles and permissions. One person may cover several roles; a business does not need all seven departments shown in the office.
Access in one organization does not transfer to another. Combining scopes requires appropriate authorization and verification of the implementation’s capabilities.
How do USER, BASE, PLUS, and BIZ differ?
Commercial direction: USER is a personal account for joining by invitation. BASE is intended as a free plan for eligible people creating one organization, with resource limits and verification under BIHUB policy.
PLUS and BIZ cover more workspaces and require approval. See Pricing for plan limits and the proposed prices.
Where does AI fit in the development vision?
Development vision: begin with Excel-first BI for consistent reporting; progress toward BCC for KPIs, accountability, and follow-up; then research Decision Intelligence.
AI could help explain changes, identify anomalies, and query data. These are research directions, not completed features or committed release dates. People remain responsible for approval and decisions.
How can we start evaluating BIHUB?
Explore the journey, try the dashboard, and choose an illustrative template on this page. For a real implementation, use one reporting period and one team to assess data quality, compilation time, and follow-up ownership.
The office and its sample dashboard use demonstration data. Use the account links to sign in or check whether registration is open.